AT&T Inc. (NYSE: T) reported third-quarter results that delivered consistent growth in Mobility service and broadband revenues as it attracts high-quality, converged customers in both 5G and fiber. Following its continued performance, the Company reiterates all full-year 2024 consolidated financial guidance.
Third-Quarter Consolidated Results
- Revenues of $30.2 billion
- Diluted EPS of $(0.03); adjusted EPS* of $0.60
- Operating income of $2.1 billion; adjusted operating income* of $6.5 billion
- Net income of $0.1 billion; adjusted EBITDA* of $11.6 billion
- Cash from operating activities of $10.2 billion, down $0.1 billion year over year; consistent year to date compared to the same period in 2023
- Capital expenditures of $5.3 billion; capital investment* of $5.5 billion
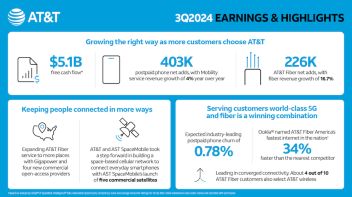
- Free cash flow* of $5.1 billion, down $0.1 billion year over year; up $2.4 billion year to date compared to the same period in 2023
Third-Quarter Highlights
- 403,000 postpaid phone net adds with an expected industry-leading postpaid phone churn of 0.78%
- Mobility service revenues of $16.5 billion, up 4.0% year over year
- 226,000 AT&T Fiber net adds; 200,000+ net adds for 19 consecutive quarters
- Consumer broadband revenues of $2.8 billion, up 6.4% year over year
- 28.3 million consumer and business locations passed with fiber
“We delivered another strong and consistent quarter, furthering our leadership in converged 5G and fiber connectivity,” said John Stankey, AT&T CEO. “Despite severe weather and a work stoppage in the Southeast, this is our 19th straight quarter of adding more than 200,000 new AT&T Fiber customers. We continue to grow our largest business – Mobility – the right way with what we expect will be industry-leading postpaid phone churn for the 13th time in 15 quarters. We are investing at the top of the industry, reducing debt and growing free cash flow year to date. These solid results give us confidence in reiterating our full-year consolidated financial guidance.”
2024 Outlook
For the full year, AT&T reiterates guidance of:
- Wireless service revenue growth in the 3% range.
- Broadband revenue growth of 7%+.
- Adjusted EBITDA* growth in the 3% range.
- Capital investment* in the $21-$22 billion range.
- Free cash flow* in the $17-$18 billion range.
- Adjusted EPS* in the $2.15-$2.25 range.
- The Company continues to expect to achieve net debt-to-adjusted EBITDA* in the 2.5x range in the first half of 2025.
- On track to pass 30 million-plus consumer and business locations with fiber by the end of 2025.
Note: AT&T’s third-quarter earnings conference call will be webcast at 8:30 a.m. ET on Wednesday, October 23, 2024. The webcast and related materials, including financial highlights, will be available at https://investors.att.com.

3Q24 Earnings & Highlights
Consolidated Financial Results
- Revenues for the third quarter totaled $30.2 billion versus $30.4 billion in the year-ago quarter, down 0.5%. This was due to lower Business Wireline service revenues and declines in Mobility equipment revenues driven by lower sales volumes. These decreases were mostly offset by higher Mobility service and Consumer Wireline revenues.
- Operating expenses were $28.1 billion versus $24.6 billion in the year-ago quarter. Operating expenses increased primarily due to a $4.4 billion non-cash goodwill impairment in the current quarter associated with our Business Wireline unit based on faster-than-previously anticipated industry-wide secular decline of legacy services. Also contributing to higher operating expenses was accelerated depreciation on wireless network equipment associated with our Open RAN network modernization efforts, and our continued network upgrades. These increases were partially offset by prior year severance and restructuring costs, lower Mobility equipment costs from lower sales volumes and benefits from continued transformation.
- Operating income was $2.1 billion versus $5.8 billion in the year-ago quarter. When adjusting for certain items, adjusted operating income* was $6.5 billion, consistent with the year-ago quarter.
- Equity in net income of affiliates was $0.3 billion, primarily from the DIRECTV investment. With adjustment for our proportionate share of intangible amortization, adjusted equity in net income from the DIRECTV investment* was $0.5 billion.
- Net income was $0.1 billion versus $3.8 billion in the year-ago quarter.
- Net income (loss) attributable to common stock was $(0.2) billion versus $3.4 billion in the year-ago quarter. Earnings per diluted common share was $(0.03) versus $0.48 in the year-ago quarter. Adjusting for $0.63 which includes a non-cash goodwill impairment, our proportionate share of intangible amortization from the DIRECTV equity method investment, and other items, adjusted earnings per diluted common share* was $0.60 compared to $0.64 in the year-ago quarter.
- Adjusted EBITDA* was $11.6 billion versus $11.2 billion in the year-ago quarter.
- Cash from operating activities was $10.2 billion, down $0.1 billion year over year, reflecting the payment of termination fees associated with network modernization programs and working capital timing, which includes higher device payments, largely offset by operational improvements.
- Capital expenditures were $5.3 billion versus $4.6 billion in the year-ago quarter.
Capital investment* totaled $5.5 billion versus $5.6 billion in the year-ago quarter. In the quarter, cash payments for vendor financing totaled $0.2 billion versus $1.0 billion in the year-ago quarter. - Free cash flow* was $5.1 billion versus $5.2 billion in the year-ago quarter.
- Total debt was $129.0 billion at the end of the third quarter, and net debt* was $125.8 billion.
Segment and Business Unit Results

Communications segment revenues were $29.1 billion, down 0.6% year over year, with operating income down 1.6% year over year.

Mobility service revenue grew 4.0% year over year driving EBITDA service margin* expansion of 150 basis points. Postpaid phone net adds were 403,000 with postpaid phone churn of 0.78%, down 1 basis point year over year.
Mobility revenues were up 1.7% year over year, driven by service revenue growth of 4.0% from subscriber gains and postpaid phone average revenue per subscriber (ARPU) growth. As part of transformation activities and simplification efforts, the Company aligned the timing of certain administrative fees and recorded approximately $90 million of one-time revenues in the third quarter that benefited service revenues, but did not result in a price increase. This was partially offset by lower equipment revenues due to lower sales volumes. Operating expenses were up 0.9% year over year due to higher depreciation expense from Open RAN deployment and network transformation, partially offset by lower equipment expenses resulting from lower sales volumes. Operating income was $7.0 billion, up 3.5% year over year. EBITDA* was $9.5 billion, up $596 million year over year, driven by service revenue growth. This was the Company’s highest-ever third-quarter Mobility EBITDA*. The Company continues to expect full-year Mobility EBITDA* growth in the higher end of the mid-single-digit range.

Business Wireline revenues and profitability declined year over year driven by continued secular pressures on legacy voice and data services that were partially offset by growth in fiber and other advanced connectivity services.
Business Wireline revenues were down 11.8% year over year, primarily due to lower demand for legacy voice and data services as well as product simplification, partially offset by growth in connectivity services. Revenue declines were also impacted by prior-year intellectual property sales of approximately $100 million and the absence of revenues from our cybersecurity business that was contributed to LevelBlue. Operating expenses were down 4.6% year over year due to lower personnel, network access and customer support expenses as well as the contribution of our cybersecurity business. Operating income was $(43) million versus $350 million in the prior-year quarter, and EBITDA* was $1.4 billion, down $339 million year over year. The Company now expects full-year Business Wireline EBITDA* to decline in the high-teens range, versus prior guidance of a mid-teens range decline.

Consumer Wireline achieved strong broadband revenue growth with improving EBITDA margins*. Consumer Wireline also delivered positive broadband net adds for the fifth consecutive quarter, driven by 226,000 AT&T Fiber net adds and 135,000 AT&T Internet Air net adds. AT&T Fiber installations were temporarily impacted by the Southeast work stoppage and Hurricane Helene.
Consumer Wireline revenues were up 2.6% year over year driven by growth in broadband revenues attributable to fiber revenues, which grew 16.7%, partially offset by declines in legacy voice and data services and other services. Operating expenses were up 1.5% year over year, primarily due to higher depreciation and increased marketing expenses, partially offset by lower customer support and network-related costs. Operating income was $196 million versus $160 million in the prior-year quarter, and EBITDA* was $1.1 billion, up $89 million year over year. The Company continues to expect full-year Consumer Wireline EBITDA* growth in the mid-to-high-single-digit range.

Latin America segment revenues were up 3.0% year over year, primarily due to higher equipment sales and subscriber growth, largely offset by unfavorable impacts of foreign exchange rates. Operating expenses were down 0.9% due to the favorable impacts of foreign exchange rates, largely offset by higher equipment and selling costs attributable to subscriber growth. Operating income was $10 million compared to $(29) million in the year-ago quarter. EBITDA* was $168 million, up $13 million year over year.
* Further clarification and explanation of non-GAAP measures and reconciliations to their most comparable GAAP measures can be found in the “Non-GAAP Measures and Reconciliations to GAAP Measures” section of the release and at https://investors.att.com.
1 Effective with our first-quarter 2024 reporting, we have removed connected devices from our total Mobility subscribers, consistent with industry standards and our key performance metrics. Connected devices include data-centric devices such as session-based tablets, monitoring devices and primarily wholesale automobile systems.
